Page 84 - IEC Insights Nov-Dec21_WEB
P. 84

FEATURE


                                             The Procurement Phase:             the Work Breakdown Structure (WBS™)
                                                                                from the field. To monitor the success or
                                             The biggest savings you can generate
                                             with a well thought through procurement   potential needs for adjustment, the order
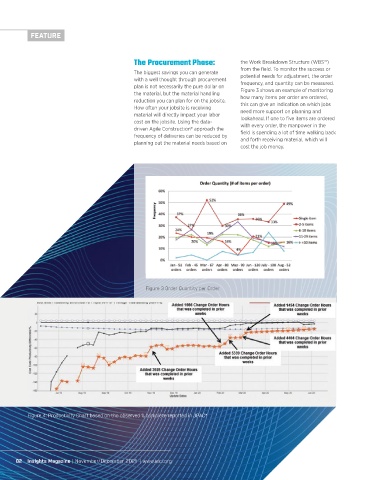
                                                                                frequency, and quantity can be measured.
                                             plan is not necessarily the pure dollar on
                                             the material, but the material handling   Figure 3 shows an example of monitoring
                                                                                how many items per order are ordered,
                                             reduction you can plan for on the jobsite.
                                             How often your jobsite is receiving   this can give an indication on which jobs
                                                                                need more support on planning and
                                             material will directly impact your labor
                                             cost on the jobsite. Using the data-  lookahead. If one to five items are ordered
                                                                                with every order, the manpower in the
                                             driven Agile Construction® approach the
                                             frequency of deliveries can be reduced by   field is spending a lot of time walking back
                                                                                and forth receiving material, which will
                                             planning out the material needs based on
                                                                                cost the job money.


                                                 Figure 3 Order Quantity per Order


          Figure 4: Productivity Chart based on the observed % complete reported in JPAC®


      82  Insights Magazine | November/December 2021  | www.ieci.org
   79   80   81   82   83   84   85   86   87   88   89